Rendering query graphs#
Rendering onetick-py query is one of the helpful debug techniques. You can use either otp.Source.render_otq for onetick-py query or render_otq function for rendering otq files.
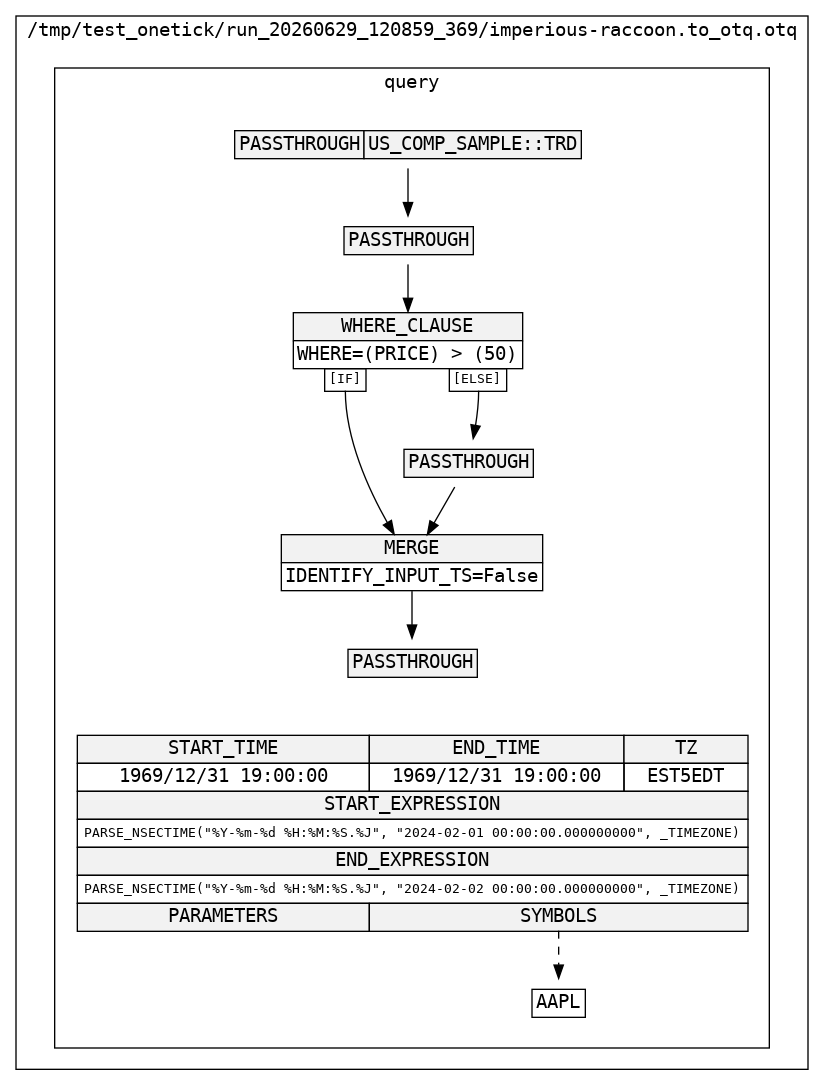
Here’s an example for simple onetick-py query:
from IPython.display import Image
import onetick.py as otp

data = otp.DataSource(db='US_COMP_SAMPLE', tick_type='TRD', symbols='AAPL')
data1, data2 = data[(data['PRICE'] > 50)]
data = otp.merge([data1, data2])
Image(data.render_otq(output_format='png'))
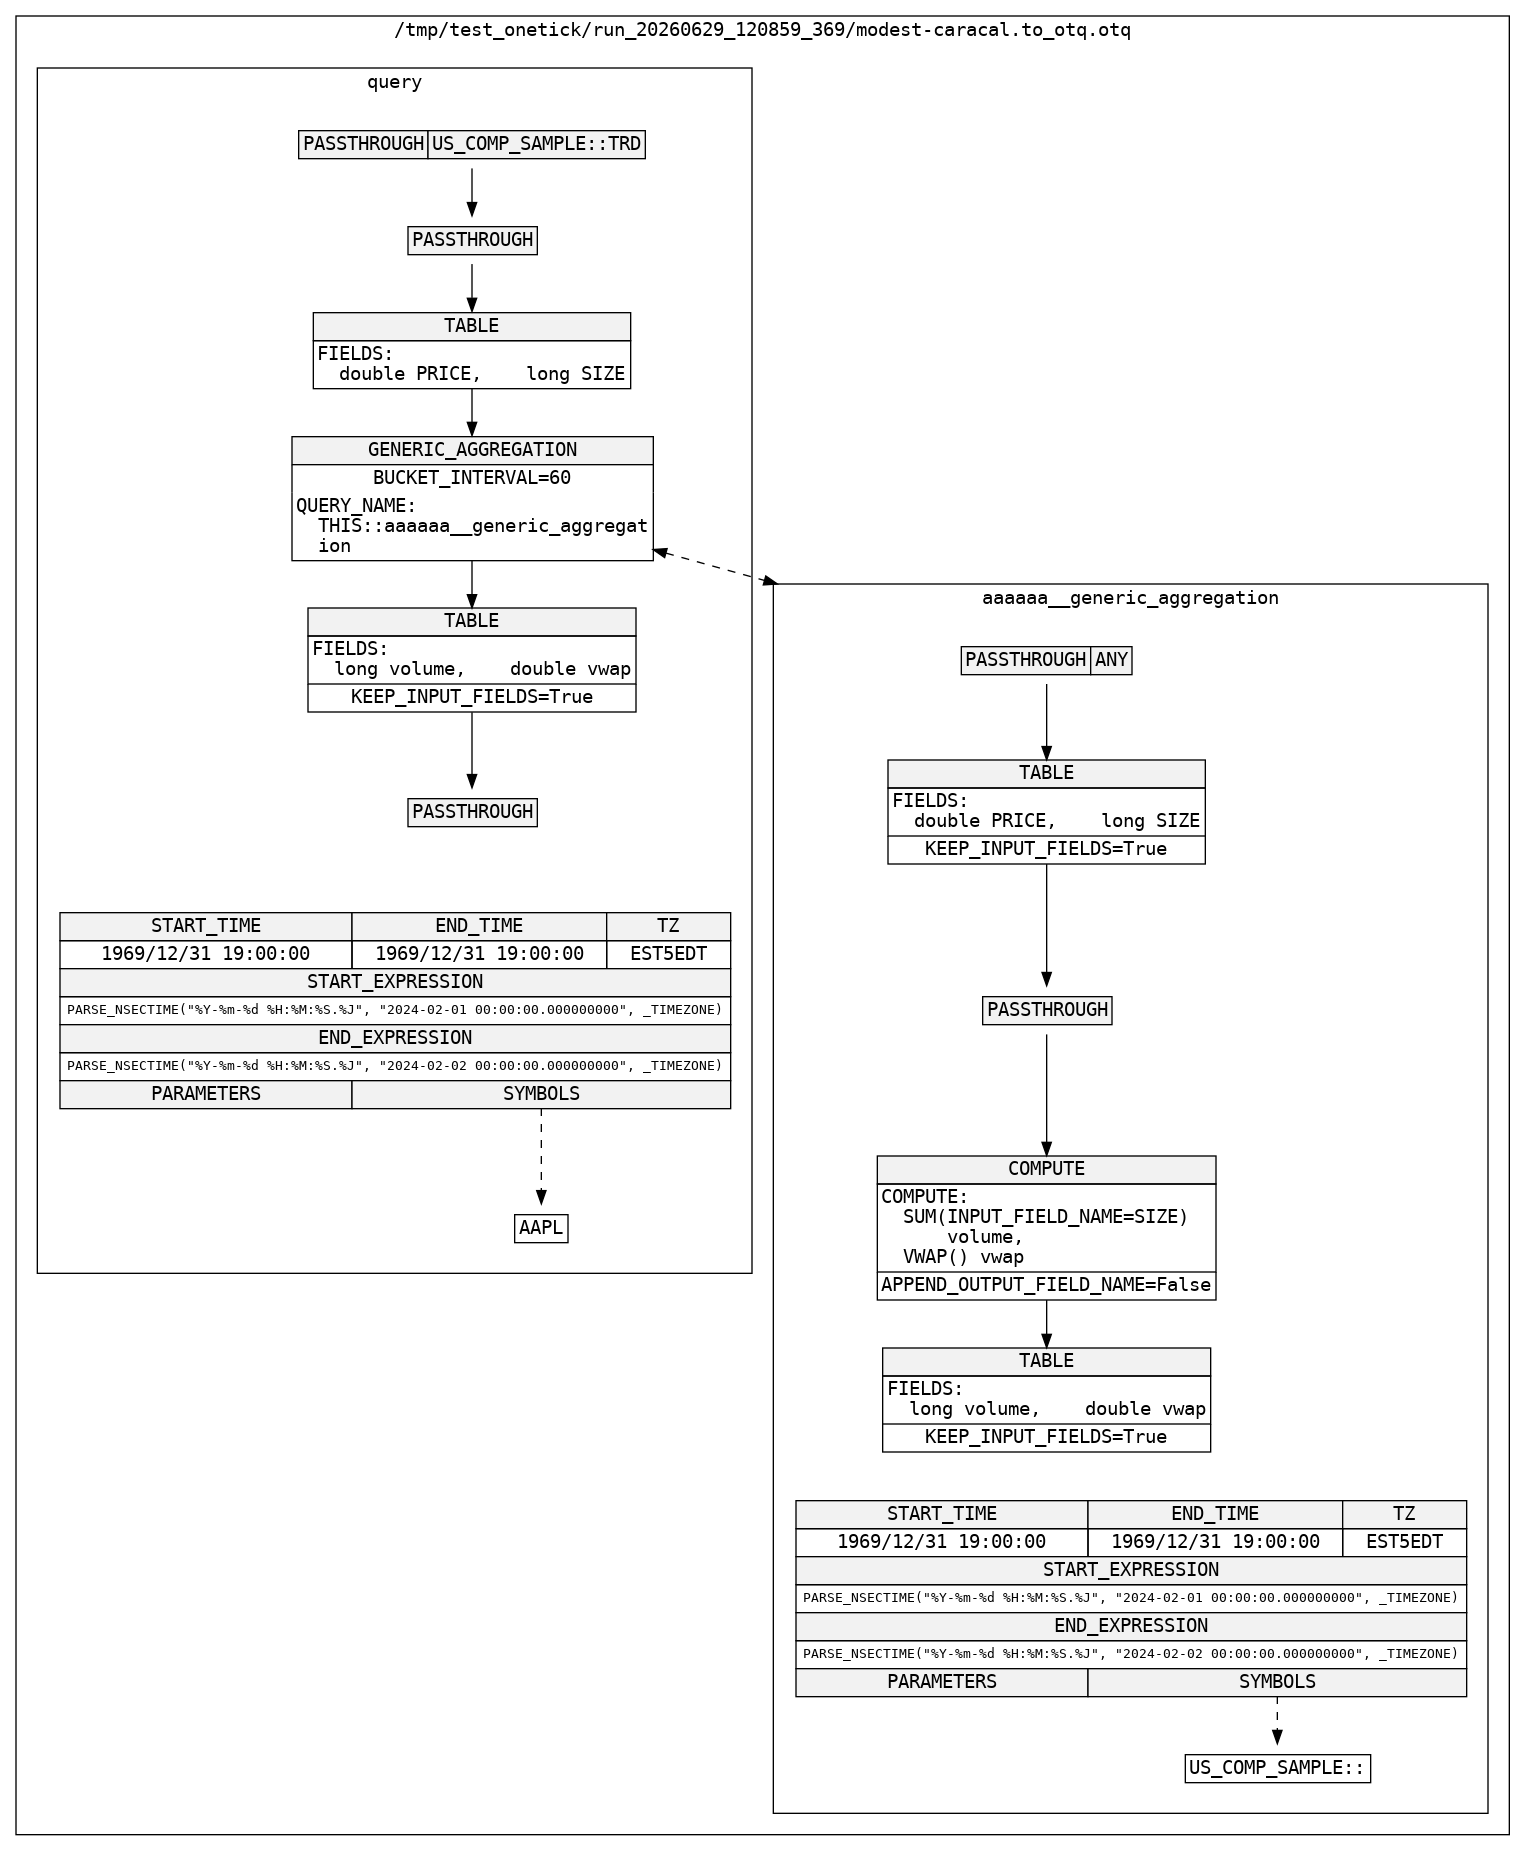
Rendering function supports graphs with nested queries:
def agg_fun(source):
    return source.agg({
        'volume': otp.agg.sum('SIZE'),
        'vwap': otp.agg.vwap('PRICE', 'SIZE')
    })

data = otp.DataSource(db='US_COMP_SAMPLE', tick_type='TRD', symbols='AAPL')
data = data[['PRICE', 'SIZE']]
data = otp.agg.generic(agg_fun, bucket_interval=otp.Minute(1)).apply(data)
Image(data.render_otq(output_format='png'))
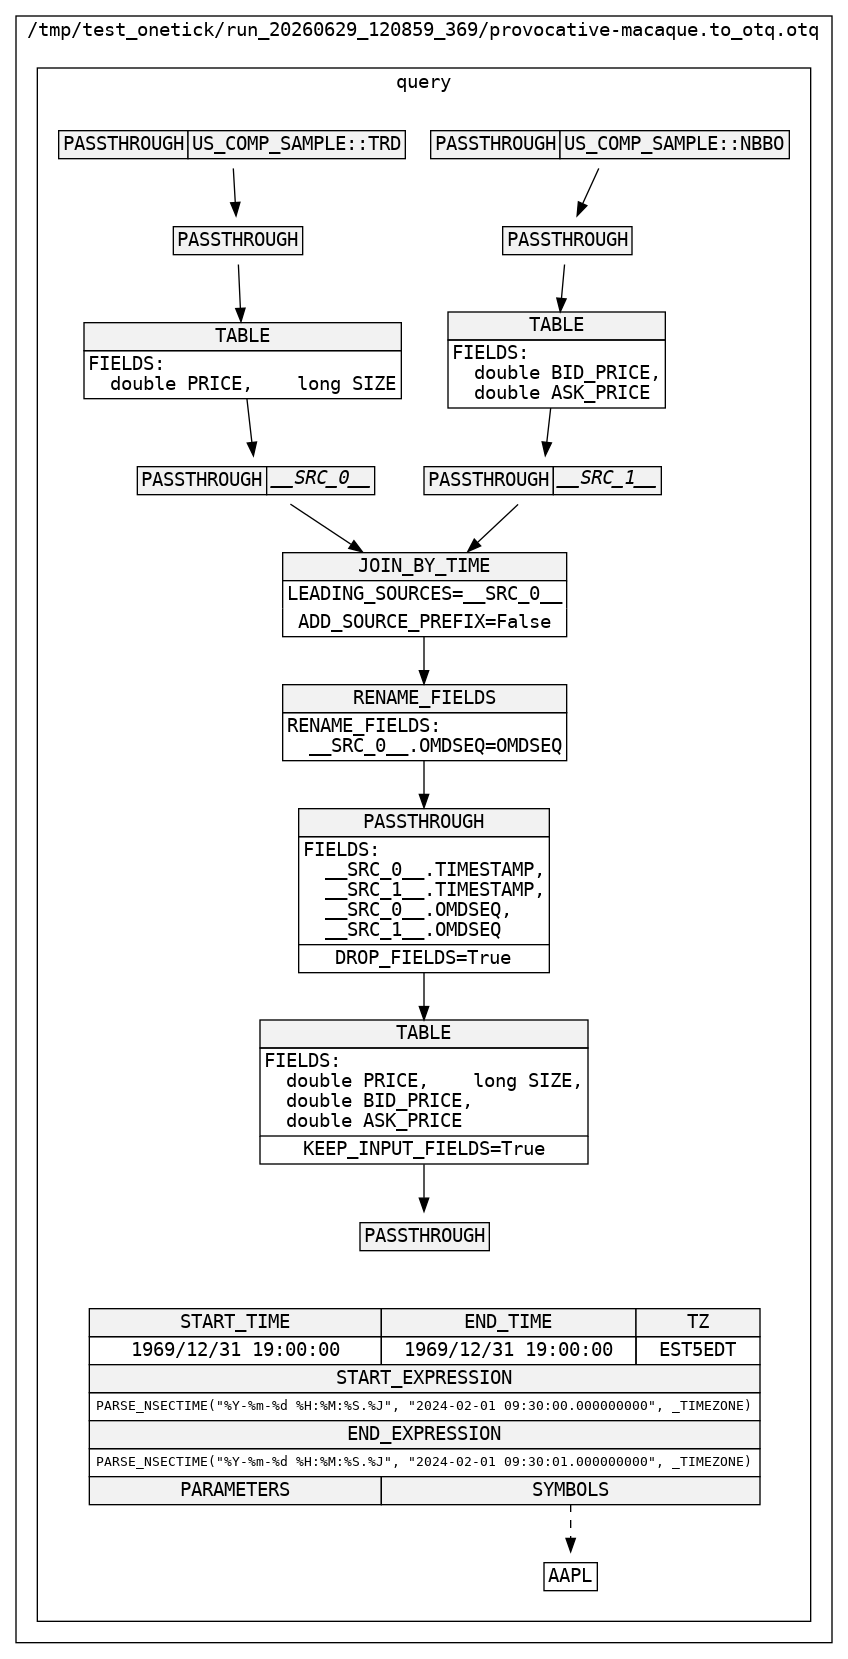
Query with multiple input sources:
start_time = otp.dt(2024, 2, 1, 9, 30)
end_time = otp.dt(2024, 2, 1, 9, 30, 1)

trd = otp.DataSource('US_COMP_SAMPLE', tick_type='TRD')
trd = trd[['PRICE', 'SIZE']]

qte = otp.DataSource('US_COMP_SAMPLE', tick_type='NBBO')
qte = qte[['BID_PRICE', 'ASK_PRICE']]

enh_trd = otp.join_by_time([trd, qte])
Image(enh_trd.render_otq(output_format='png', symbols=['AAPL'], start=start_time, end=end_time))
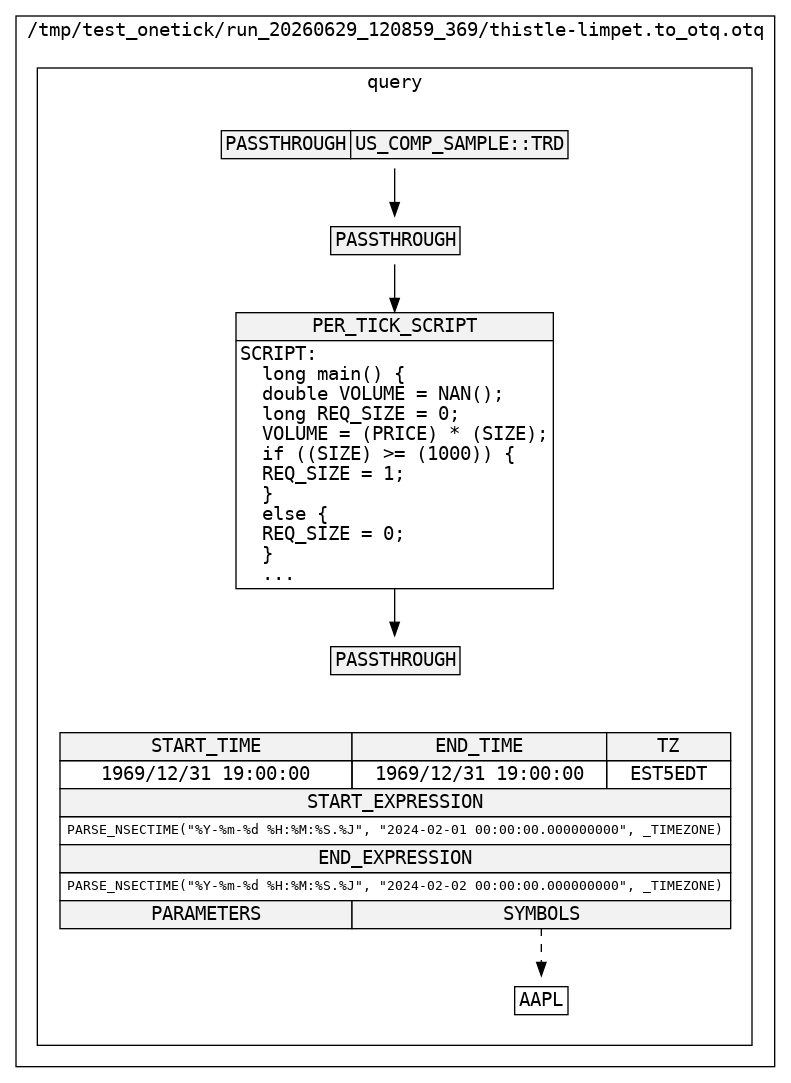
Query with Per Tick Script:
def fun(tick):
    tick['VOLUME'] = tick['PRICE'] * tick['SIZE']
    if tick['SIZE'] >= 1000:
        tick['REQ_SIZE'] = 1
    else:
        tick['REQ_SIZE'] = 0

data = otp.DataSource(db='US_COMP_SAMPLE', tick_type='TRD', symbols='AAPL')
data = data.script(fun)
Image(data.render_otq(output_format='png'))