Corporate Actions#
Adjusting prices for corporate actions#
We can use built-in functions to adjust price and volume for corporate actions.
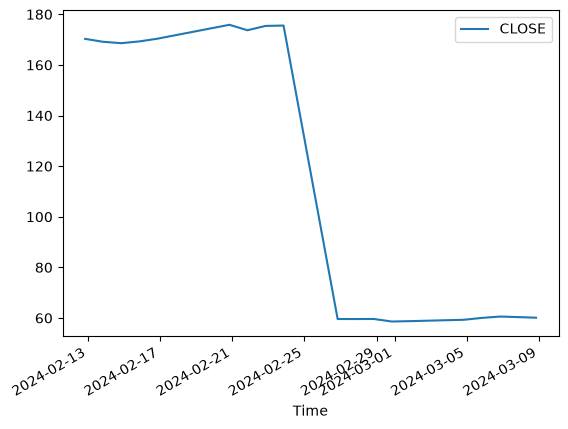
We follow an example of a 1:3 split for WMT on Feb 26, 2024. First let’s review the unadjusted data: there appears to be a price jump.
import onetick.py as otp

data = otp.DataSource('US_COMP_SAMPLE_DAILY', tick_type='DAY')
data = data[['CLOSE', 'VOLUME', 'EXCHANGE']]
data = data.where(data['EXCHANGE'] == '')
result = otp.run(data,
                 start=otp.dt(2024, 2, 10),
                 end=otp.dt(2024, 3, 10),
                 symbols='WMT')
result.plot(x='Time', y='CLOSE')
<Axes: xlabel='Time'>
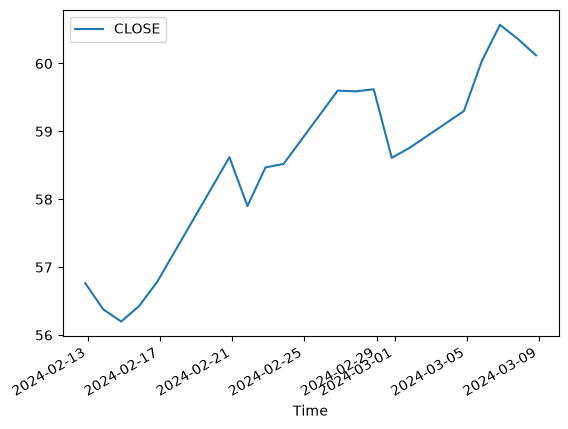
Adding adjustment for corporate actions fixes this.
The prices are adjusted to the level before or after the split depending on the value of the adjustement_date parameter.
The next example illustrates this:
data = otp.DataSource('US_COMP_SAMPLE_DAILY', tick_type='DAY')
data = data[['CLOSE', 'VOLUME', 'EXCHANGE']]
data = data.where(data['EXCHANGE'] == '')
data['ORG_CLOSE'] = data['CLOSE']
data = data.corp_actions(fields='CLOSE', adjust_rule='PRICE', apply_split=True)
result = otp.run(data,
                 start=otp.dt(2024, 2, 10),
                 end=otp.dt(2024, 3, 10),
                 timezone='America/New_York',
                 symbols='WMT',
                 symbol_date=otp.dt.now())

result.plot(x='Time', y='CLOSE')
<Axes: xlabel='Time'>
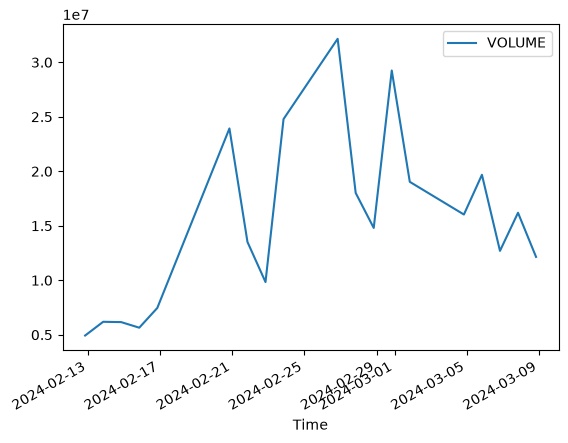
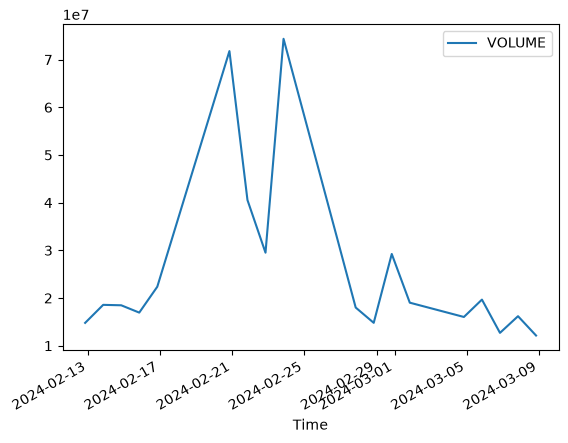
Adjustment can be applied to sizes in a similar way:
data = otp.DataSource(db='US_COMP_SAMPLE_DAILY', tick_type='DAY')
data = data[['CLOSE', 'VOLUME', 'EXCHANGE']]
data = data.where(data['EXCHANGE'] == '')
result = otp.run(data,
                 start=otp.dt(2024, 2, 10),
                 end=otp.dt(2024, 3, 10),
                 timezone='America/New_York',
                 symbols='WMT',
                 symbol_date=otp.dt.now())
result.plot(x='Time', y='VOLUME')
<Axes: xlabel='Time'>
data = otp.DataSource(db='US_COMP_SAMPLE_DAILY', tick_type='DAY')
data = data[['CLOSE', 'VOLUME', 'EXCHANGE']]
data = data.where(data['EXCHANGE'] == '')
data['ORG_VOLUME'] = data['VOLUME']
data = data.corp_actions(fields='VOLUME', adjust_rule='SIZE', apply_split=True)
result = otp.run(data,
                 start=otp.dt(2024, 2, 10),
                 end=otp.dt(2024, 3, 10),
                 timezone='America/New_York',
                 symbols='WMT',
                 symbol_date=otp.dt.now())
result.plot(x='Time', y='VOLUME')
<Axes: xlabel='Time'>
Retrieving Corporate actions for a symbol#
We can retrieve all corporate actions for the symbols of interest:
db = otp.databases()['US_COMP_SAMPLE_DAILY']
db.ref_data(
    ref_data_type='corp_actions',
    start=otp.dt(2024, 2, 10),
    end=otp.dt(2024, 3, 10),
    timezone='America/New_York',
    symbol='WMT',
    symbol_date=otp.dt.now(),
)
| Time | MULTIPLICATIVE_ADJUSTMENT | ADDITIVE_ADJUSTMENT | ADJUSTMENT_TYPE | |
|---|---|---|---|---|
| 0 | 2024-02-26 | 0.333333 | 0.0 | SPLIT |