Corporate Actions#
This is part of the OQD offering. Available in OneTick Cloud. Can be configured on prem.
Adjusting prices for corporate actions#
We can use built-in functions to adjust price and volume for corporate actions.
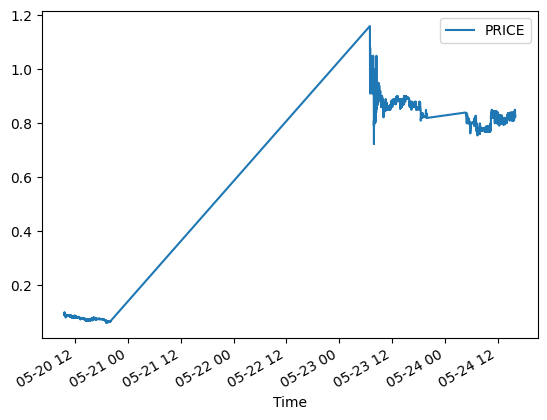
We follow an example of a 1:15 split for MKD on May 23, 2022. First let’s review the unadjusted data: there appears to be a price jump.
import onetick.py as otp
import matplotlib

trd = otp.DataSource('NYSE_TAQ', tick_type='TRD', start=otp.dt(2022, 5, 20, 9, 30), end=otp.dt(2022, 5, 24, 16))
t = otp.run(trd, symbols='MKD')
t.plot(x='Time', y='PRICE')
<AxesSubplot: xlabel='Time'>
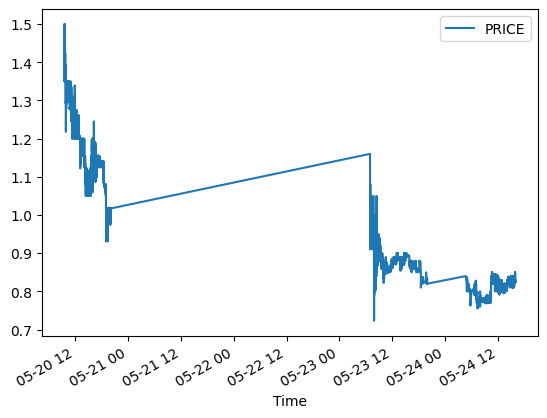
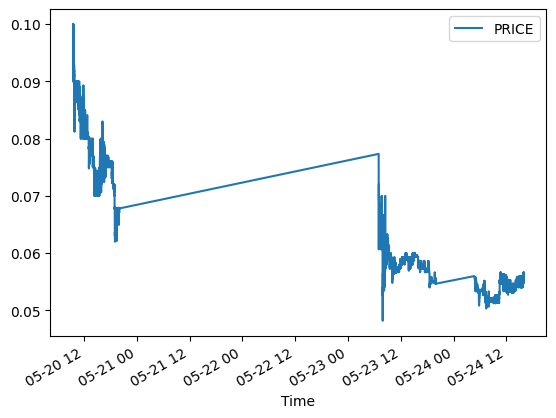
Adding adjustment for corporate actions fixes this. The prices are adjusted to the level before or after the split depending on the value of the adjustement_date parameter. The next two examples illustrate this.
trd = otp.DataSource('NYSE_TAQ',
                     tick_type='TRD',
                     start=otp.dt(2022, 5, 20, 9, 30),
                     end=otp.dt(2022, 5, 24, 16))
trd = otp.functions.corp_actions(trd,
                                 adjustment_date=20220524,
                                 fields="PRICE")

r = otp.run(trd, symbols='MKD', symbol_date=otp.dt(2022, 5, 20))
r.plot(x='Time', y='PRICE')
<AxesSubplot: xlabel='Time'>
trd = otp.DataSource('NYSE_TAQ',
                     tick_type='TRD',
                     start=otp.dt(2022, 5, 20, 9, 30),
                     end=otp.dt(2022, 5, 24, 16))
trd = otp.functions.corp_actions(trd,
                                 adjustment_date=20220520,
                                 fields="PRICE")

r = otp.run(trd, symbols='MKD', symbol_date=otp.dt(2022, 5, 20))
r.plot(x='Time', y='PRICE')
<AxesSubplot: xlabel='Time'>
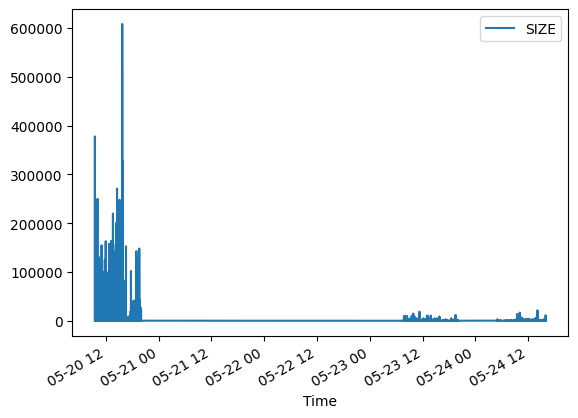
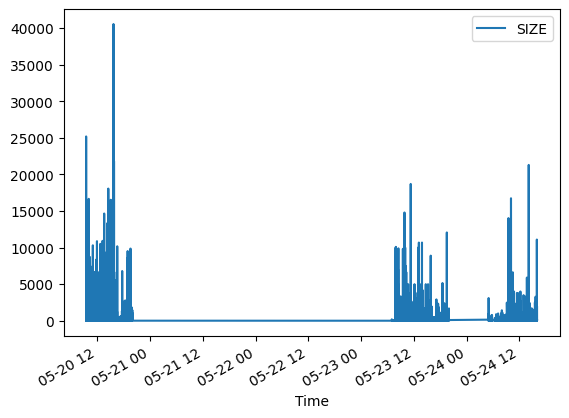
Adjustment can be applied to sizes in a similar way.
trd = otp.DataSource('NYSE_TAQ',
                     tick_type='TRD',
                     start=otp.dt(2022, 5, 20, 9, 30),
                     end=otp.dt(2022, 5, 24, 16))

r = otp.run(trd, symbols='MKD', symbol_date=otp.dt(2022, 5, 20))
r.plot(x='Time', y='SIZE')
<AxesSubplot: xlabel='Time'>
trd = otp.DataSource('NYSE_TAQ',
                     tick_type='TRD',
                     start=otp.dt(2022, 5, 20, 9, 30),
                     end=otp.dt(2022, 5, 24, 16))
trd = otp.functions.corp_actions(trd,
                                 adjustment_date=20220524,
                                 adjust_rule='SIZE',
                                 fields='SIZE')

r = otp.run(trd, symbols='MKD', symbol_date=otp.dt(2022, 5, 20))
r.plot(x='Time', y='SIZE')
<AxesSubplot: xlabel='Time'>
Retrieving Corporate actions for a symbol#
We can retrieve all corporate actions for the symbols of interest.
cacs = otp.oqd.sources.CorporateActions()

cacs = otp.merge([cacs], symbols=['TDEQ::::MKD', 'TDEQ::::AAPL'], identify_input_ts=True)

otp.run(cacs, start=otp.dt(2020, 5, 1), end=otp.dt(2023, 4, 10), symbol_date=otp.dt(2022, 2, 1))
| Time | OID | ACTION_ID | ACTION_TYPE | ACTION_ADJUST | ACTION_CURRENCY | ANN_DATE | EX_DATE | PAY_DATE | REC_DATE | TERM_NOTE | TERM_RECORD_TYPE | ACTION_STATUS | SYMBOL_NAME | TICK_TYPE | |
|---|---|---|---|---|---|---|---|---|---|---|---|---|---|---|---|
| 0 | 2020-05-07 20:00:00 | 9706 | 16118282 | CASH_DIVIDEND | 0.820000 | USD | 20200430 | 20200508 | 20200514 | 20200511 | CASH:0.82@USD | NORMAL | TDEQ::::AAPL | CACS | |
| 1 | 2020-08-06 20:00:00 | 9706 | 16330650 | CASH_DIVIDEND | 0.820000 | USD | 20200730 | 20200807 | 20200813 | 20200810 | CASH:0.82@USD | NORMAL | TDEQ::::AAPL | CACS | |
| 2 | 2020-08-30 20:00:00 | 9706 | 16330651 | SPLIT | 0.250000 | 20200730 | 20200831 | 20200828 | 20200824 | STOCK:3.00000000@9706 | NORMAL | TDEQ::::AAPL | CACS | ||
| 3 | 2020-11-05 19:00:00 | 9706 | 16558868 | CASH_DIVIDEND | 0.205000 | USD | 20201029 | 20201106 | 20201112 | 20201109 | CASH:0.205@USD | NORMAL | TDEQ::::AAPL | CACS | |
| 4 | 2021-02-04 19:00:00 | 9706 | 16799540 | CASH_DIVIDEND | 0.205000 | USD | 20210127 | 20210205 | 20210211 | 20210208 | CASH:0.205@USD | NORMAL | TDEQ::::AAPL | CACS | |
| 5 | 2021-05-06 20:00:00 | 9706 | 17098817 | CASH_DIVIDEND | 0.220000 | USD | 20210428 | 20210507 | 20210513 | 20210510 | CASH:0.22@USD | NORMAL | TDEQ::::AAPL | CACS | |
| 6 | 2021-08-05 20:00:00 | 9706 | 17331864 | CASH_DIVIDEND | 0.220000 | USD | 20210727 | 20210806 | 20210812 | 20210809 | CASH:0.22@USD | NORMAL | TDEQ::::AAPL | CACS | |
| 7 | 2021-11-04 20:00:00 | 9706 | 17522810 | CASH_DIVIDEND | 0.220000 | USD | 20211028 | 20211105 | 20211111 | 20211108 | CASH:0.22@USD | NORMAL | TDEQ::::AAPL | CACS | |
| 8 | 2022-02-03 19:00:00 | 9706 | 17597137 | CASH_DIVIDEND | 0.220000 | USD | 20220127 | 20220204 | 20220210 | 20220207 | CASH:0.22@USD | NORMAL | TDEQ::::AAPL | CACS | |
| 9 | 2022-05-05 20:00:00 | 9706 | 17640491 | CASH_DIVIDEND | 0.230000 | USD | 20220428 | 20220506 | 20220512 | 20220509 | CASH:0.23@USD | NORMAL | TDEQ::::AAPL | CACS | |
| 10 | 2022-05-22 20:00:00 | 688935 | 17653162 | SPLIT | 14.999992 | 19100101 | 20220523 | 20220523 | 20220523 | STOCK:-0.93333330@688935 | NORMAL | TDEQ::::MKD | CACS | ||
| 11 | 2022-08-04 20:00:00 | 9706 | 17685165 | CASH_DIVIDEND | 0.230000 | USD | 20220728 | 20220805 | 20220811 | 20220808 | CASH:0.23@USD | NORMAL | TDEQ::::AAPL | CACS | |
| 12 | 2022-11-03 20:00:00 | 9706 | 17728529 | CASH_DIVIDEND | 0.230000 | USD | 20221027 | 20221104 | 20221110 | 20221107 | CASH:0.23@USD | NORMAL | TDEQ::::AAPL | CACS | |
| 13 | 2023-02-09 19:00:00 | 9706 | 17801892 | CASH_DIVIDEND | 0.230000 | USD | 20230202 | 20230210 | 20230216 | 20230213 | CASH:0.23@USD | NORMAL | TDEQ::::AAPL | CACS |